PBX Monitor and Resource Monitor can be useful to monitor the performance of your phone system. For example, monitoring the CPU and Memory can reveal the behavior of your system. PBX Monitor allows you to watch active concurrent calls, conference, extension status and trunk status. Using PBX Monitor and Resource Monitor, you can:
- View real-time data simultaneously from any number of computers.
- See the change charts to reflect current activity, and show counter values that are updated real time.
- Monitor the extension or trunks status to find the problem and you can edit the extension/trunks/conference through the monitor panel directly.
If you are running Yeastar S-Series VoIP PBX or Yeastar Cloud PBX, use the “PBX Monitor” and “Resource Monitor” graphical tool to measure the performance of your PBX is easy and efficient. The monitor panel in S-Series shows a variety of statistical information about your system, such as:
- How many calls are active
- How many trunks are active
- The CPU/Memory/Storage/Network usage
- The status of your system uptime
PBX Monitor
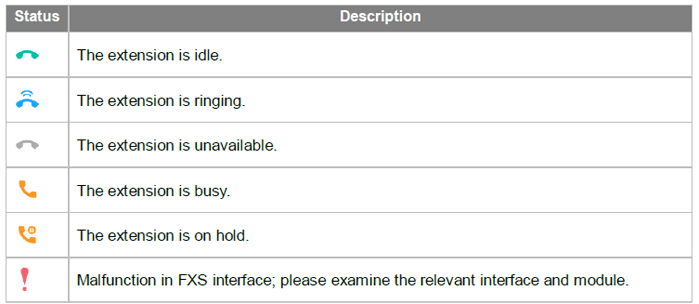
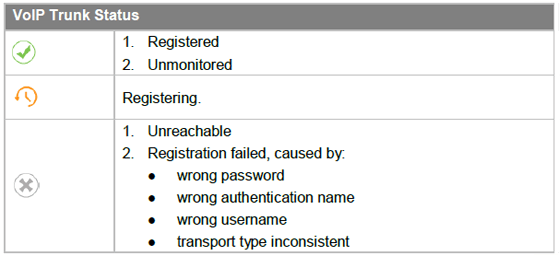
The PBX monitors the status of Extensions, Trunks, Concurrent Call and Conference. The real-time status can help you quickly monitor if the system extensions or trunks are working and registered correctly. And you will be able to see the conference moderator, how many members in the conference, when the conference starts. The information of the status will be shown upon mouseover.
Extension Status

VoIP Trunk Status

You can also monitor status of FXO trunk, GSM/WCDMA trunk, BRI/E1/T1 trunk, concurrent calls, and conference.
Resource Monitor
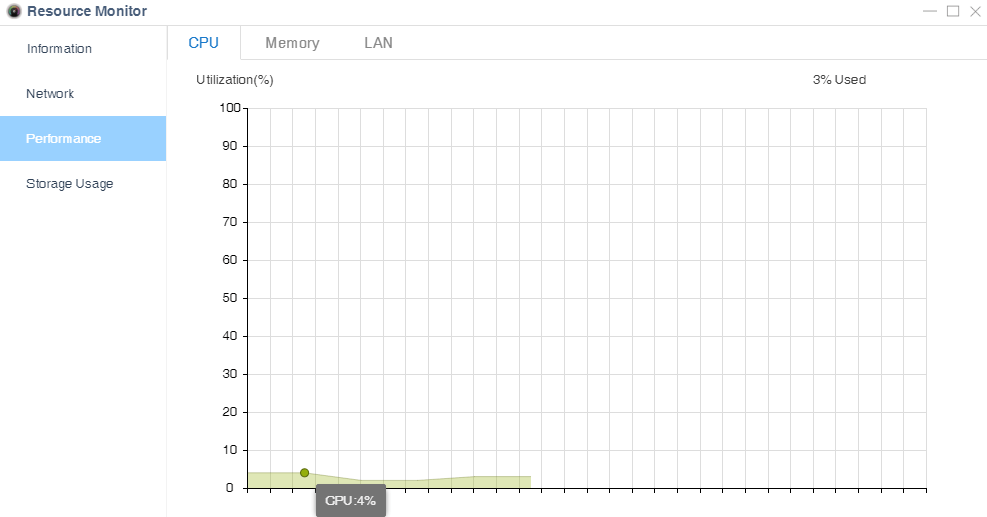
Resource monitor allows you to monitor the use of hardware (CPU, memory, storage, and network) and system resources in real time. the resource monitor includes four tabs:
Information: displays the system information, including Product, Serial Number, Hardware Version, Software Version, System Time, Uptime etc.
Network: shows system’s network status, including MAC Address, IP Address, Gateway, VPN Server, etc.
Performance: presents the resource utilization data. It is the current processor usage. The information of the chart will be shown upon mouseover.
- CPU: provides area chart of real-time CPU Usage
- Memory: shows overall Memory consumption; column chart of Total Memory, Used, Buffer, Cache and Available.
- LAN: displays Processes with Network Activity, including Send and Receive.
Storage Usage: displays Processes with Disk Activity and Storage; charts of Disk Usage (KB/sec) and Disk Queue Length. Ensure you have enough space for call recordings and logs.

S-Series VoIP PBX: Real-time CPU Monitor
You might also be interested in:
Yeastar Remote Management is a robust centralized platform for easy management and configuration of your customer-premises PBXs, giving you the power to quickly and securely take control without having to travel to the equipment. At a fraction of cost, you can access this amazing tool to maximize ease of use for both yourself and your customers.


Q850 =16 code appearing more often
what makes the CPU performance of TE100 get high when VMWare server is accessing the TE100 for our web appls
Hello Dennis,
Thanks for your questions. This answer is more than just a few words can describe. We recommend you to click here to submit your inquiry so one of our technical support can get your question solved.