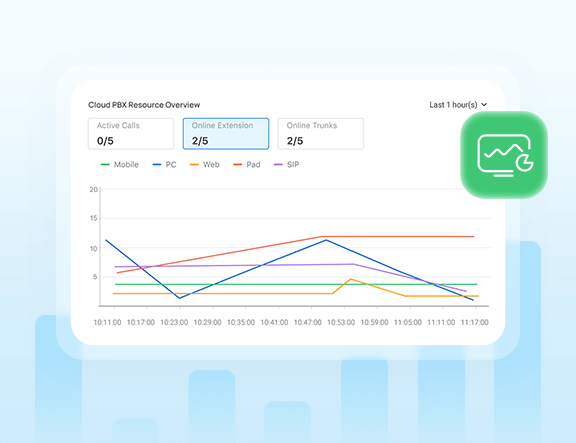
Easier Issue Identification and PBX Capacity Planning for Your P-Series Phone System End Customers
We are thrilled to introduce new PBX monitoring tools on Yeastar Central Management (YCM) platform! Expanding on the existing Cloud PBX Status, Device Status, and PBX Alarm Trend monitoring, this update introduces 5 new data widgets, allowing partners to easily monitor their end customers’ real-time and historical usage of PBX resources including extensions, concurrent calls, and more for early issue identification and per-PBX capacity planning.
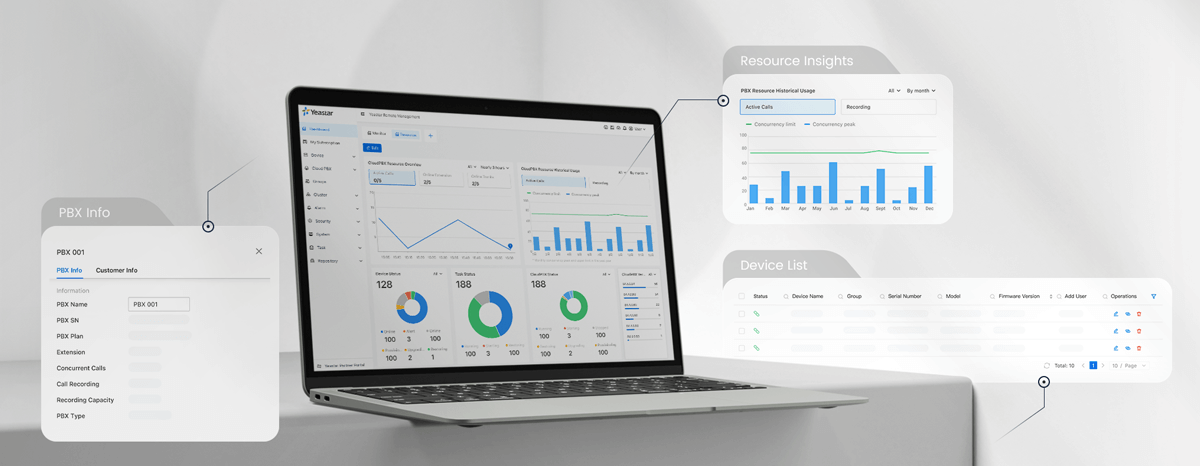
The new data widgets cover all editions of P-Series Phone System. Read on to find out what’s been added.
- See details on resource monitoring for P-Series Cloud Edition ➔
- See details on resource monitoring for P-Series Software & Appliance Edition ➔
- See system requirements to use the new data widgets ➔
List of the new data widgets and their application scope:
| Monitoring Object | Data Widget (Monitoring Metrics) |
|---|---|
| • P-Series Cloud Edition | • PBX Resource Overview (Extension, Trunk, Concurrent Call) • PBX Resource Historical Usage (Concurrent Call, Recording Minutes) • PBX Trunk/IP Phone Offline Monitoring (Only available for Yeastar BYOI partners) |
| • P-Series Software Edition • P-Series Appliance Edition |
• PBX Resource Overview (Extension, Trunk, Concurrent Call) • PBX Resource Historical Usage (Concurrent Call) • PBX CPU, Memory, and Load Metrics (CPU Utilization, Memory Usage, Disk Usage) |
| • P-Series Software Edition Only | • PBX Network Inflow and Outflow Rate |
Resource Monitoring for P-Series Cloud Edition
As a Yeastar cloud hosting partner or reseller, you can monitor your P-Series Cloud PBX’s real-time and historical resources using the following two data widgets. These widgets are available on the YCM platform’s Dashboard tab (to track aggregated data of all your cloud PBXs) and the Cloud PBX List tab (to track data of individual Cloud PBX).
Widget 1: Cloud PBX Resource Overview
Track real-time concurrent call number, online extensions, and SIP trunks on your PBX for early issue identification
This data widget provides an overview of the current number of active calls (concurrent calls), online extensions, and online SIP trunks on your P-Series Cloud PBX. It also displays comparative values such as the PBX’s concurrent call limit and the total number of created extensions and SIP trunks, enabling a quick assessment of resource utilization.
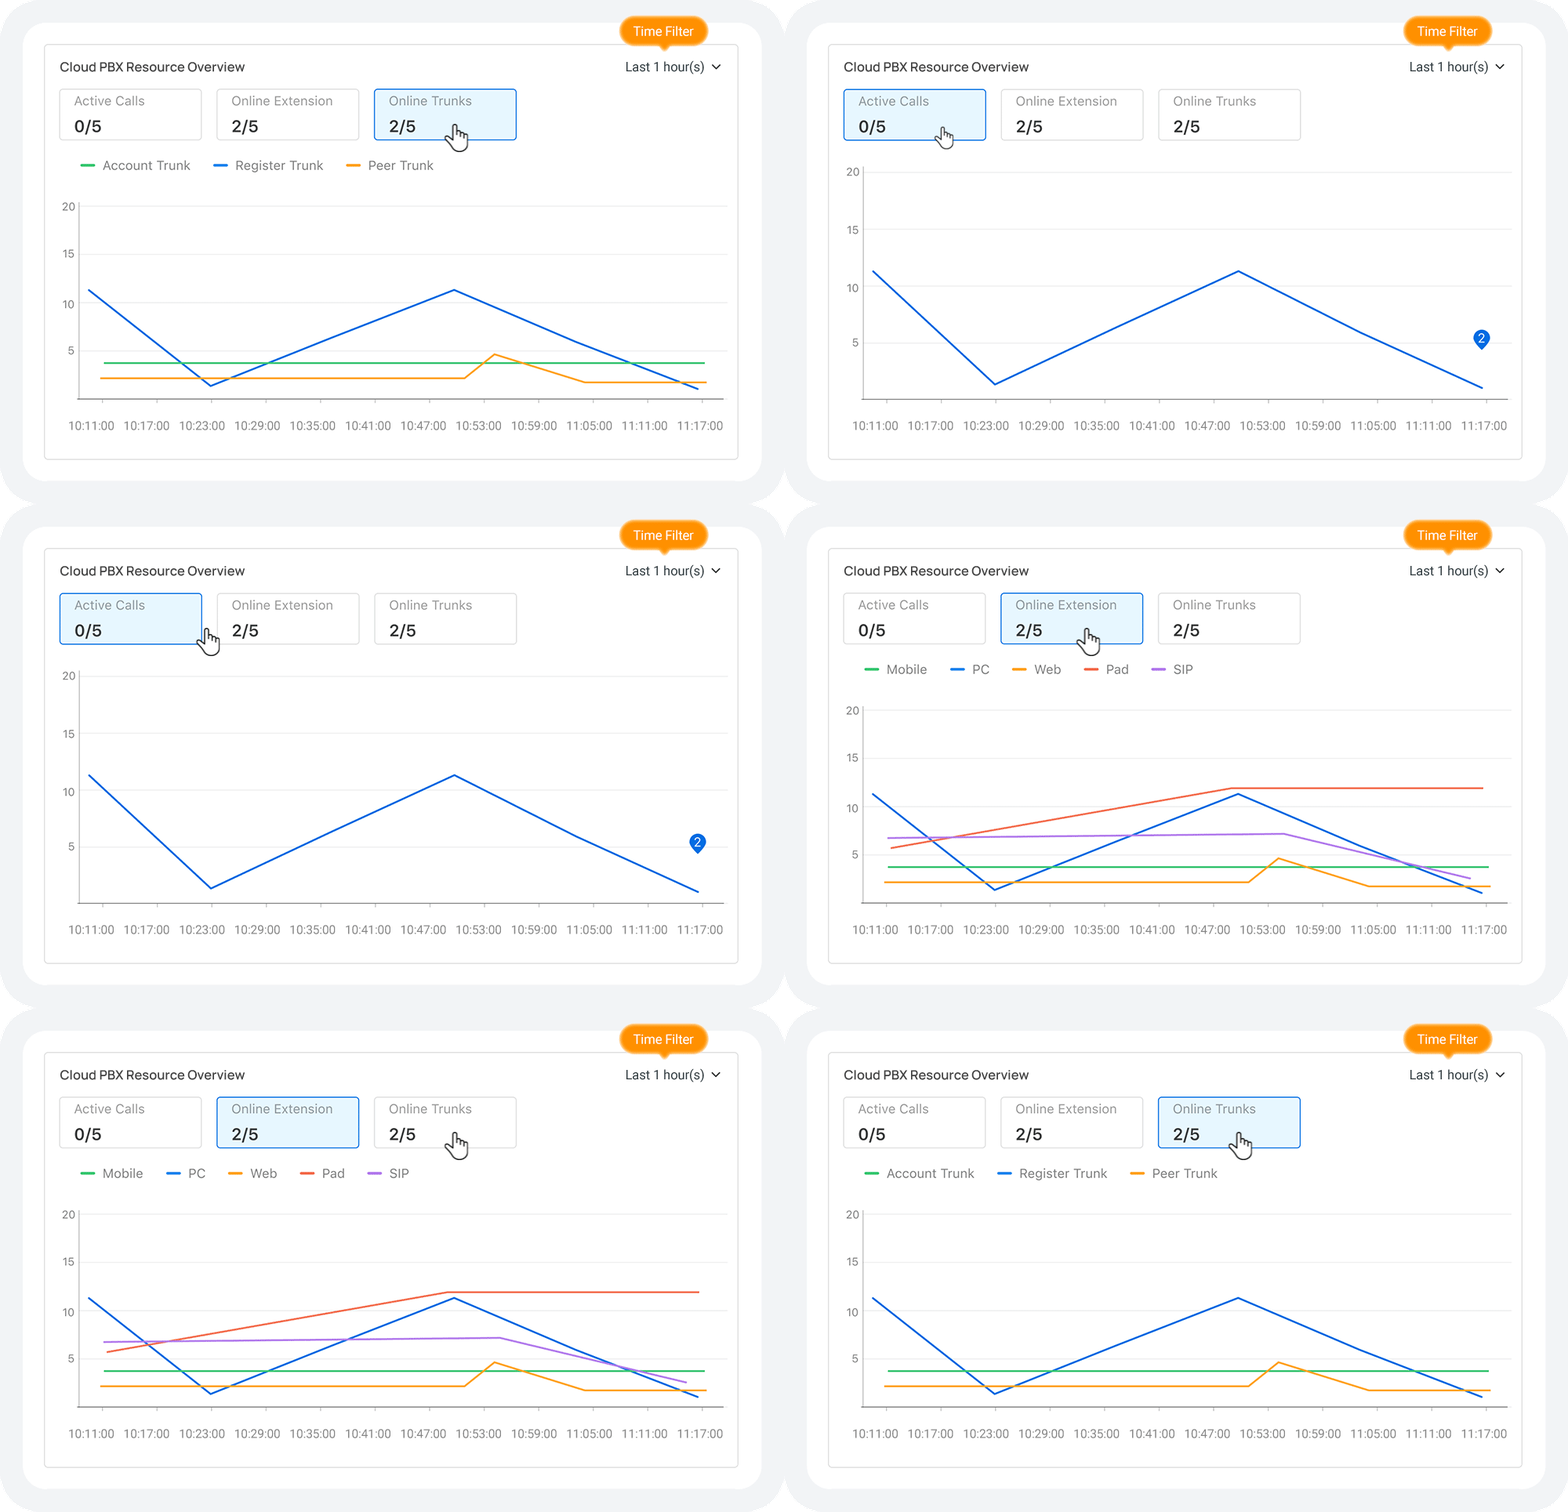
Additionally, the widget also features line charts that track changes in these metrics over the past 24 hours. For extension trend lines, the data is broken down by terminal type (Linkus Web/Mobile/Desktop, SIP, FXS), and for trunk trend lines, it’s granulated by trunk type (Account trunk, Peer trunk, Register trunk).
By leveraging these comprehensive data, partners can quickly monitor call traffic trends, identify peak usage times, and track trunk and extension health to maintain reliable connectivity for end customers.
Widget 2: Cloud PBX Resource Historical Usage
Monitor long-term usage trends of concurrent calls and recording minutes by week or month for capacity planning
This data widget displays actual peak usage for concurrent calls and recording minutes by month or week for the past 12 months.
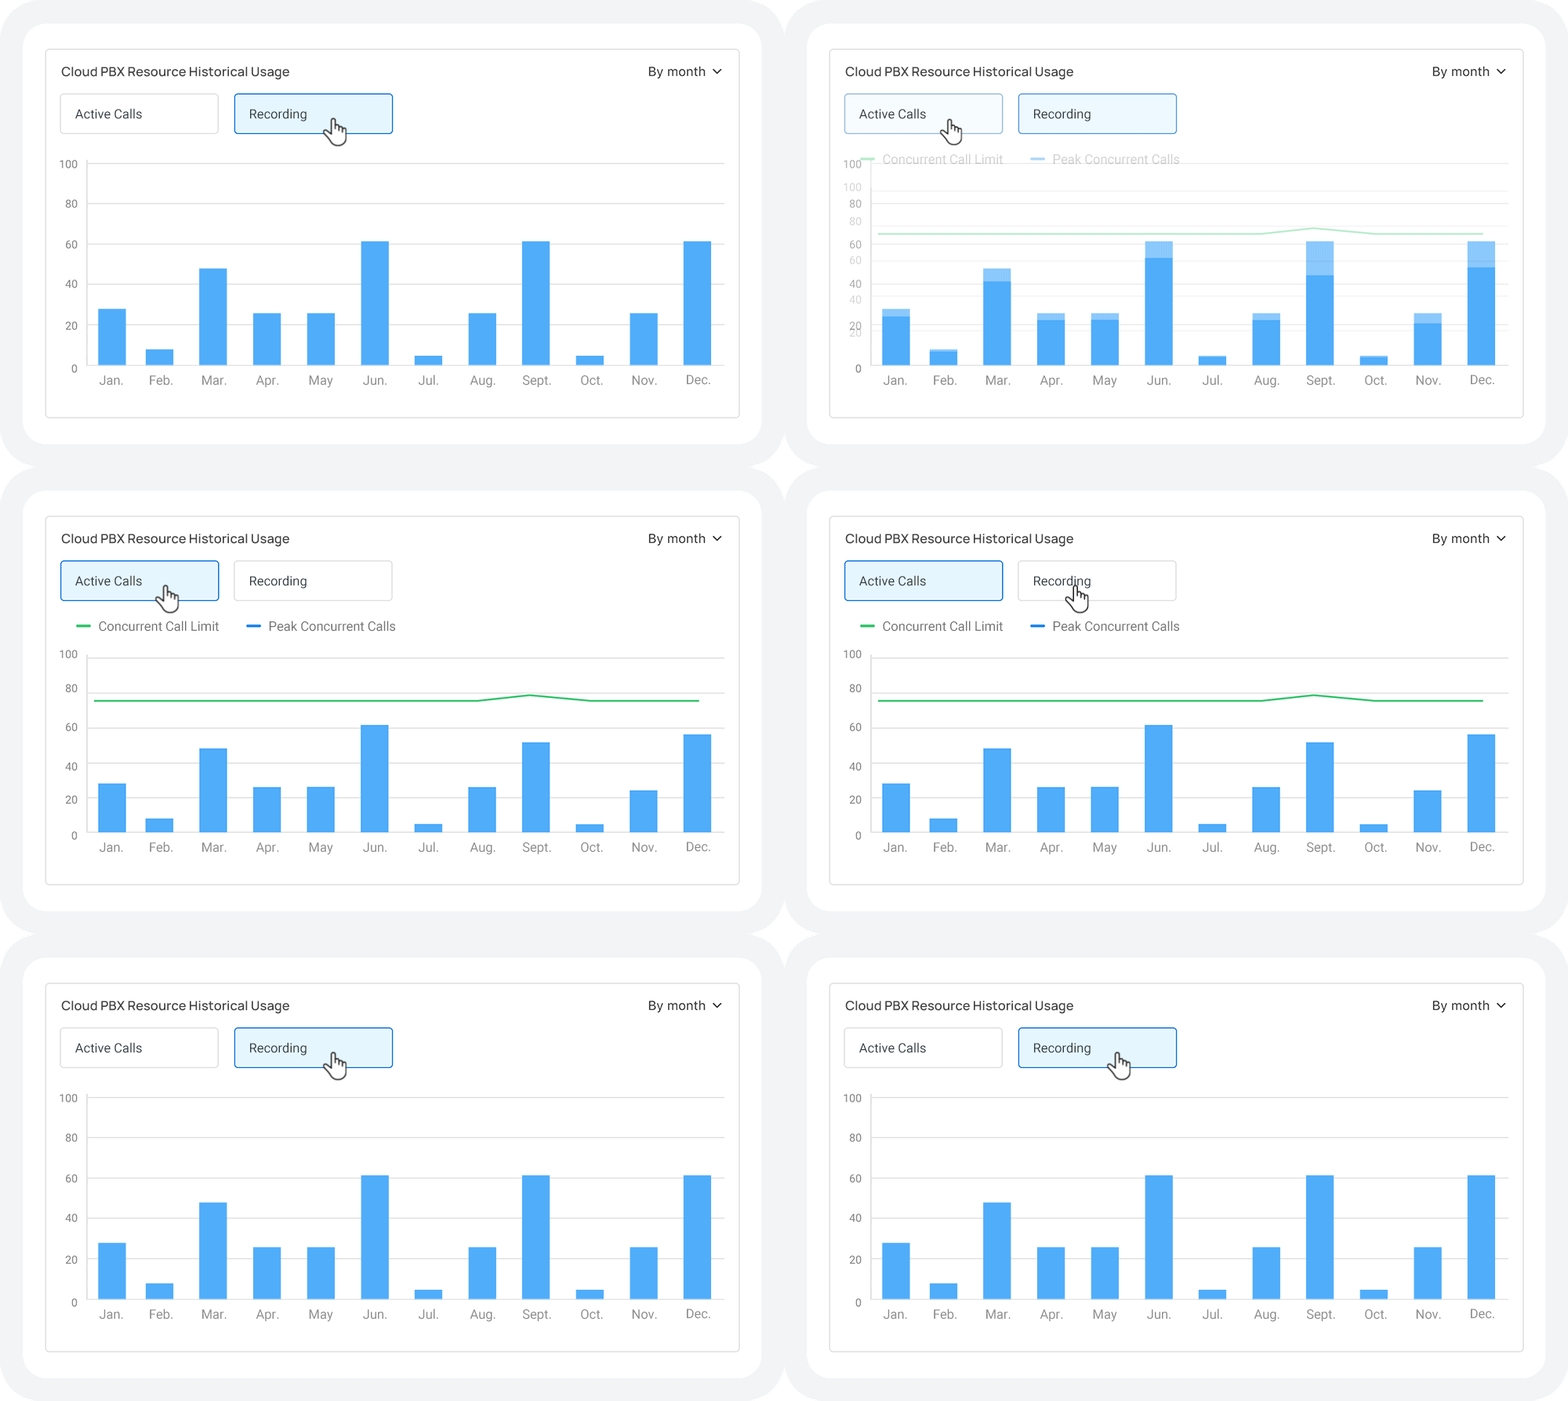
By analyzing long-term call activity trends and recording storage needs, partners can make better-informed decisions on capacity planning for customers, as well as spot opportunities for upselling.
For details on resource monitoring for P-Series Cloud Edition, please refer to the user guide for per Cloud PBX monitoring and the user guide for total cloud PBX overview monitoring.
Additional Data Widget for Yeastar Cloud BYOI Partners
If you are a Yeastar Cloud BYOI (Bring Your Own Infrastructure) partner, you get an additional data widget on both the Dashboard tab and the Cluster > Server Monitor tab. This widget allows you to monitor the offline status of SIP trunks and IP phones of your P-Series Cloud PBXs within a specific PBXHub server and time period.
Note: The “offline status” here refers to the number the SIP Trunks whose status changes from “Registered” to “Registration Failed” or the number of IP Phones whose status changes from “Online” to “Offline”.
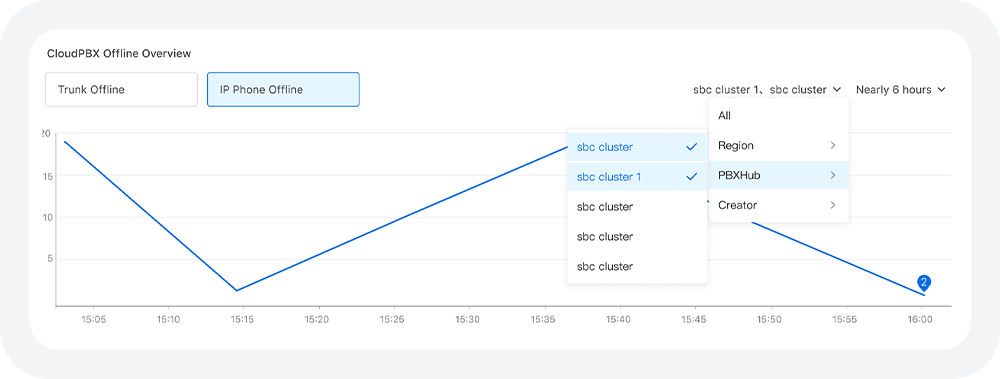
By monitoring these data, you can assess the health of trunk and IP phone connections and quickly identify any frequent or bulk disconnections, which may indicate server-level issues that impact call quality for your customers.
For more monitoring tools for BYOI partners and their details, please refer to the user guide for cluster server performance monitoring and offline status monitoring.
Resource Monitoring for P-Series Software & Appliance Edition
The monitoring capabilities for P-Series Software & Appliance Editions extend beyond just PBX resource usage (extension, concurrent calls, trunks). They also include comprehensive system performance metric monitoring such as CPU utilization, memory usage, storage usage, and network inflow/outflow rate.
With a simple click from the My Device List, you can monitor these data for each of your connected P-Series Software or Appliance PBX.
For a deeper understanding, here are a brief introduction to the available data widgets and their monitoring scope.
Widget 1: Device Resource Overview
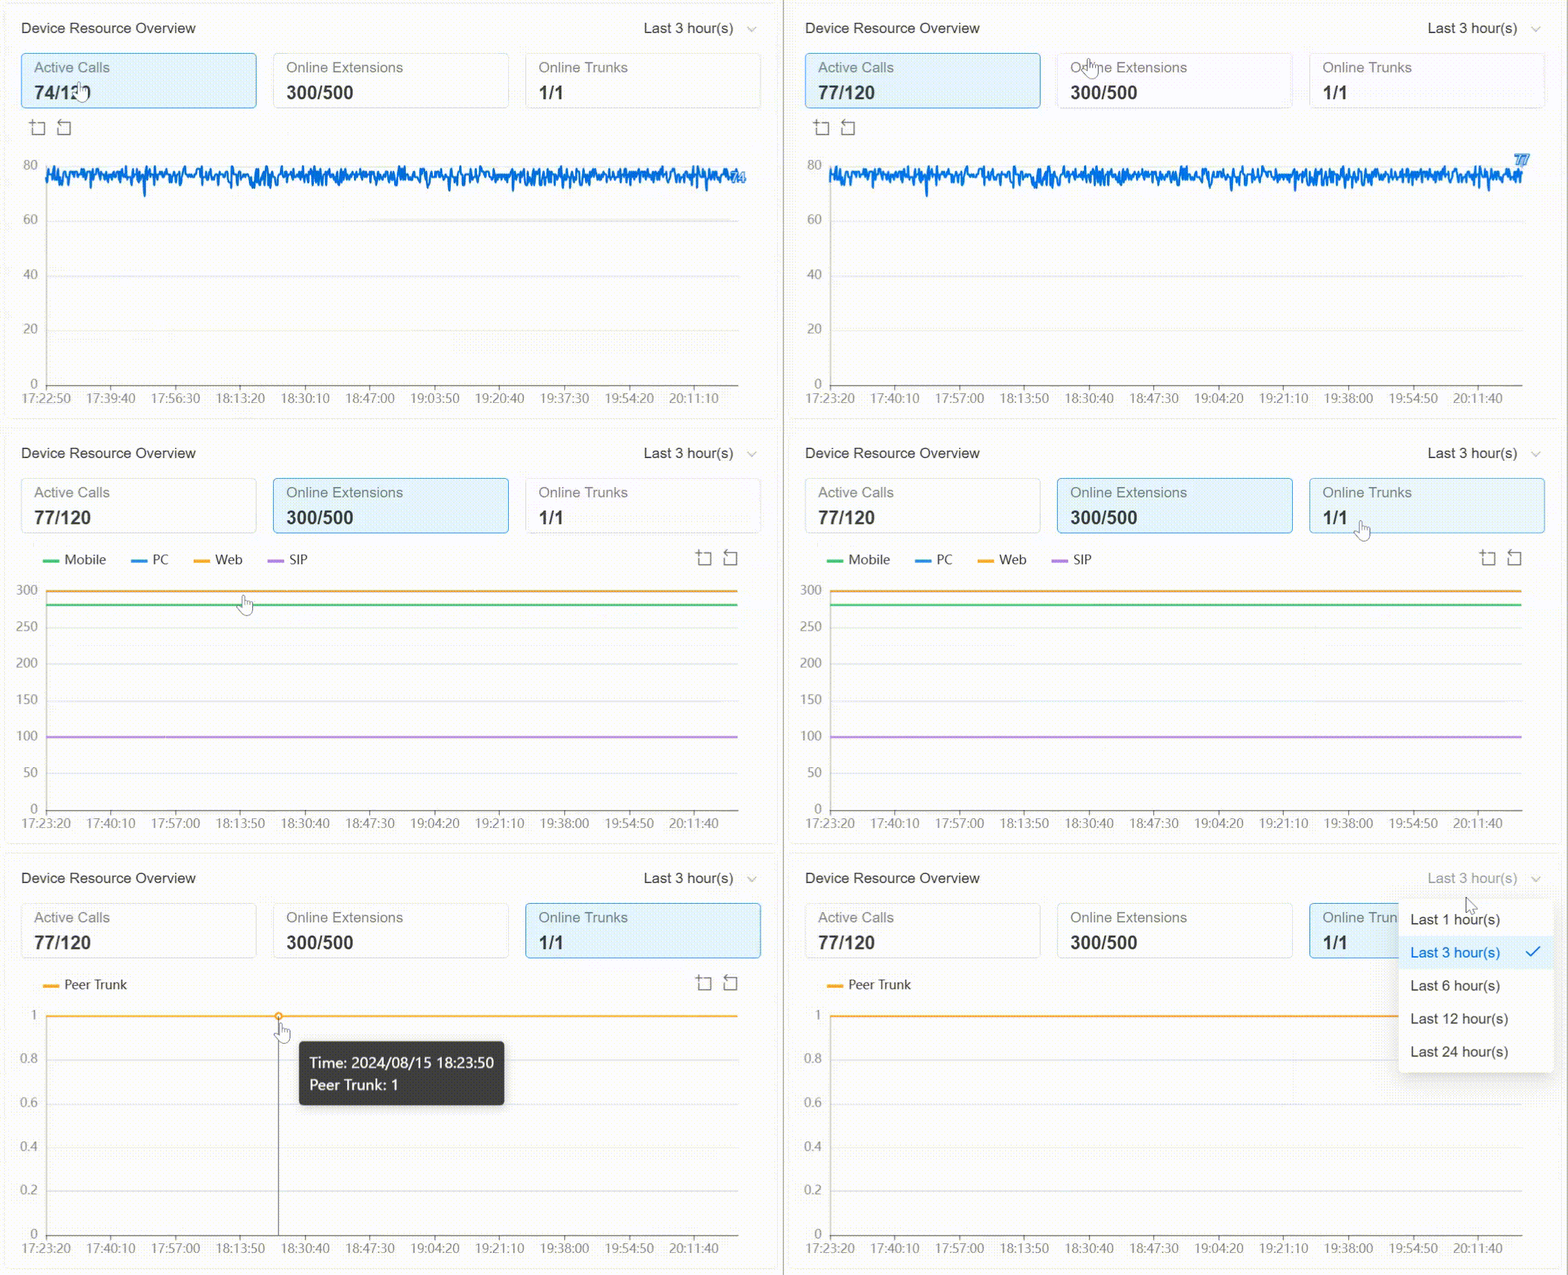
Use Case: Track and show the current number counts of concurrent calls, online extensions, and SIP trunks on the PBX. The line charts display the changes of these number over the last 1 hour, 3 hours, 6 hours, 12 hours, or 24 hours based on what you selected. These data will help you quickly monitor call traffic trend of a PBX and detect abnormal changes in online extensions and online trunk number.
Widget 2: Device Resource Historical Usage
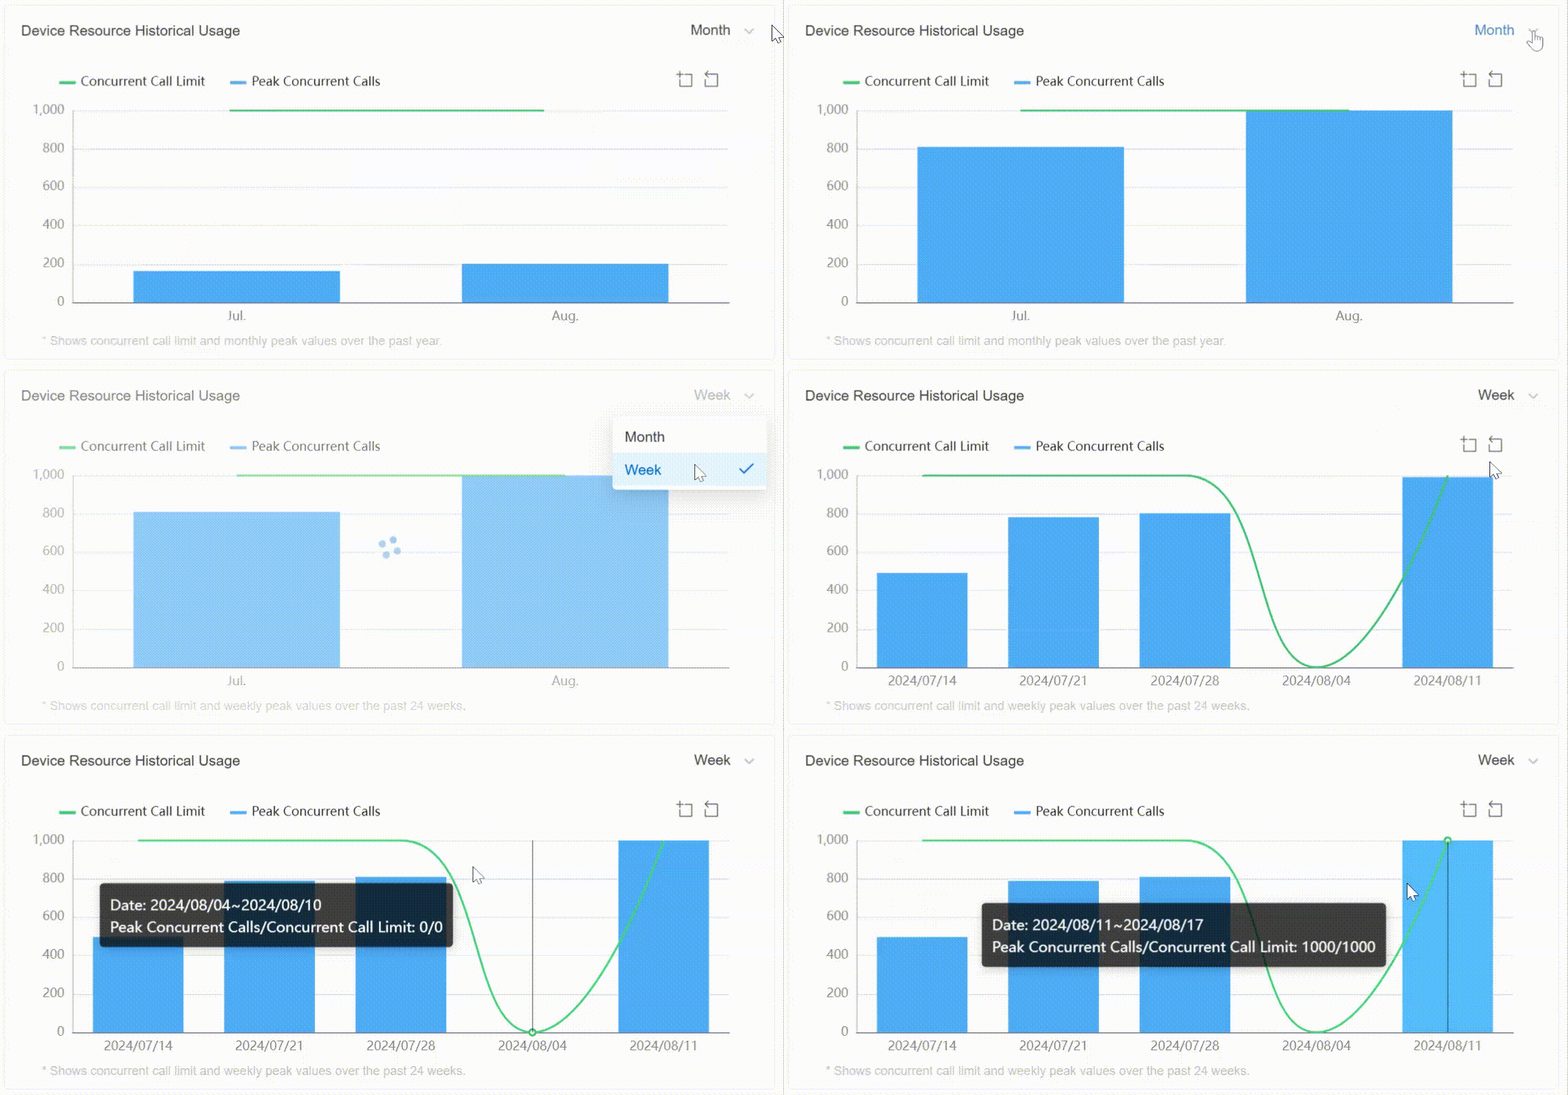
Use Case: Monitor the PBX’s peek values of concurrent calls by week or month. Best for evaluating if the PBX has sufficient concurrent call resources, and leverage the data for strategic planning in PBX capacity scaling and upselling.
Widget 3: CPU, Memory, and Storage Usage
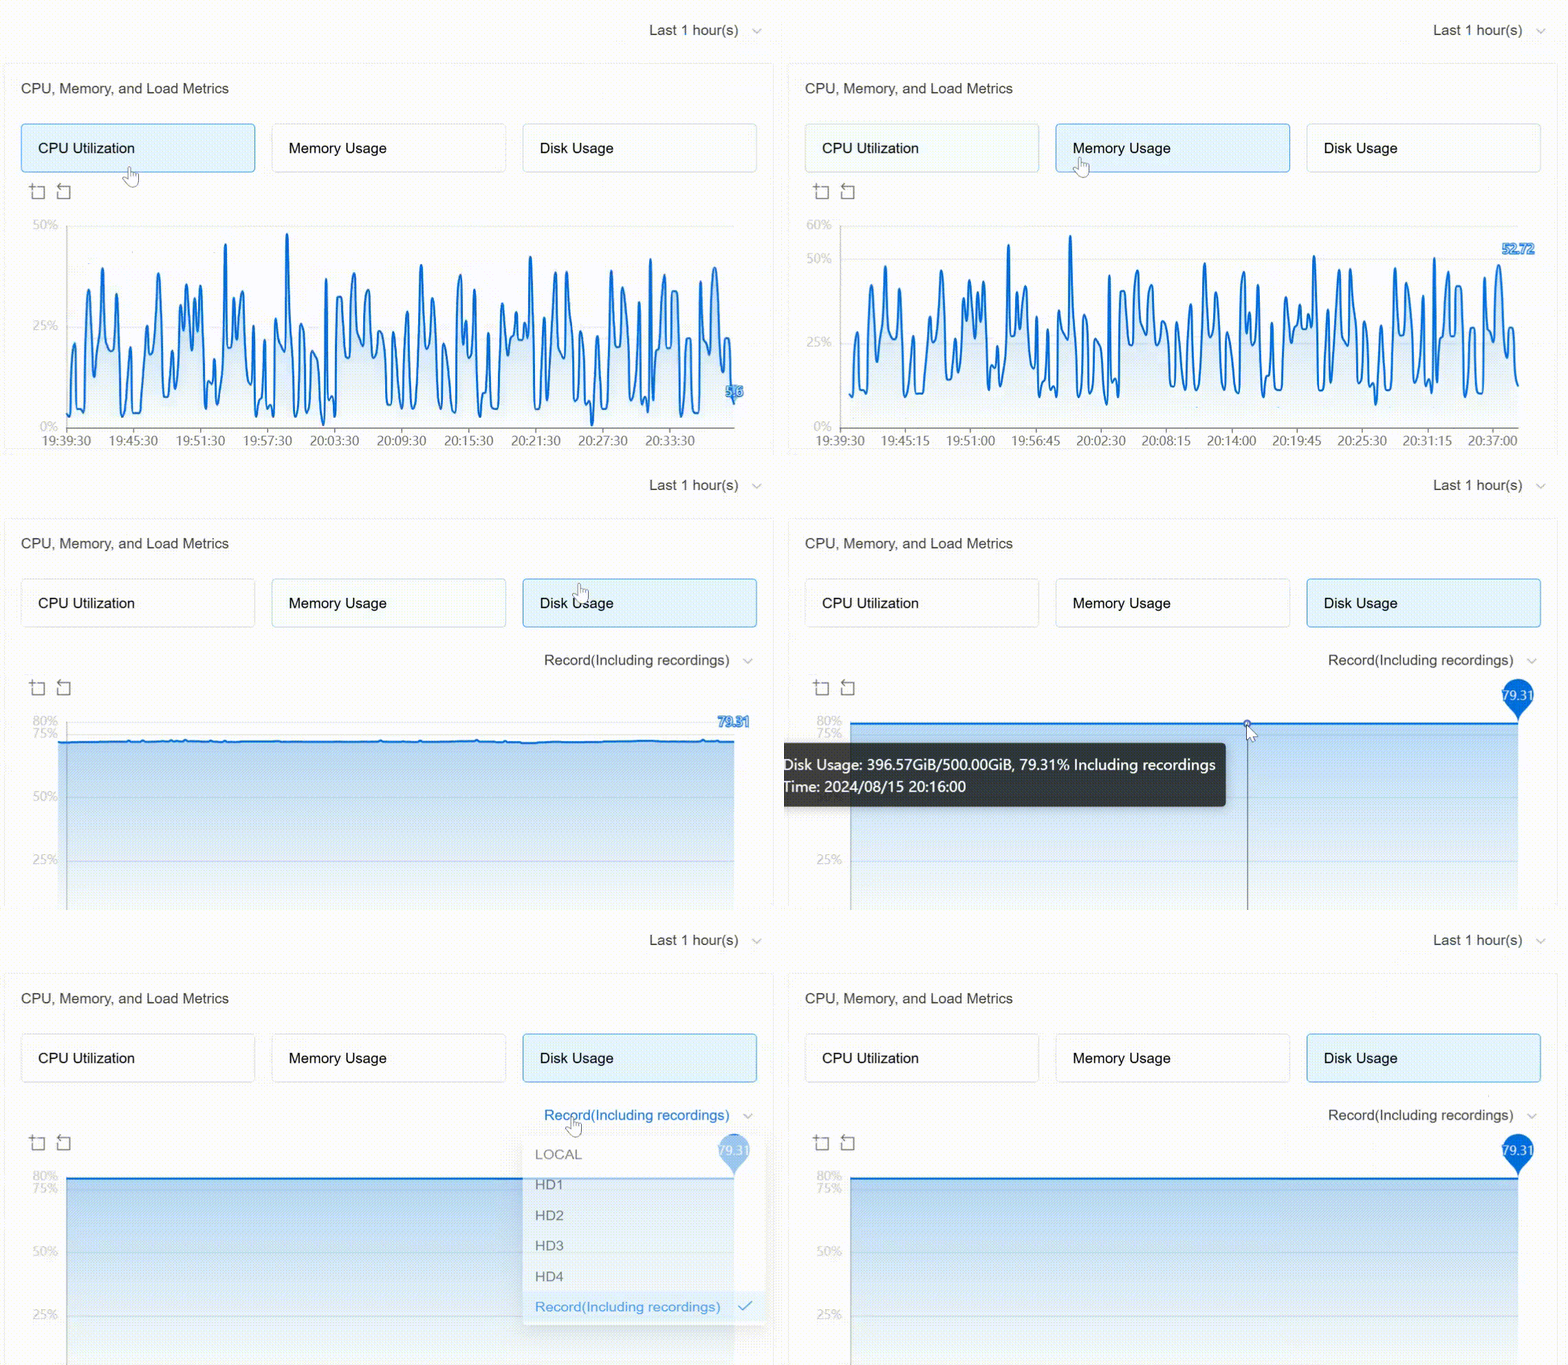
Use Case: Monitor the PBX’s CPU utilization rate, memory usage rate, and disk usage rate (per storage location) over the past hours, days, or a custom time range you selected. These data are displayed with line charts, so you can easily detect any sudden surges or drops and quickly react to potential issues before they escalate.
Widget 4: Network Inflow and Outflow Rate
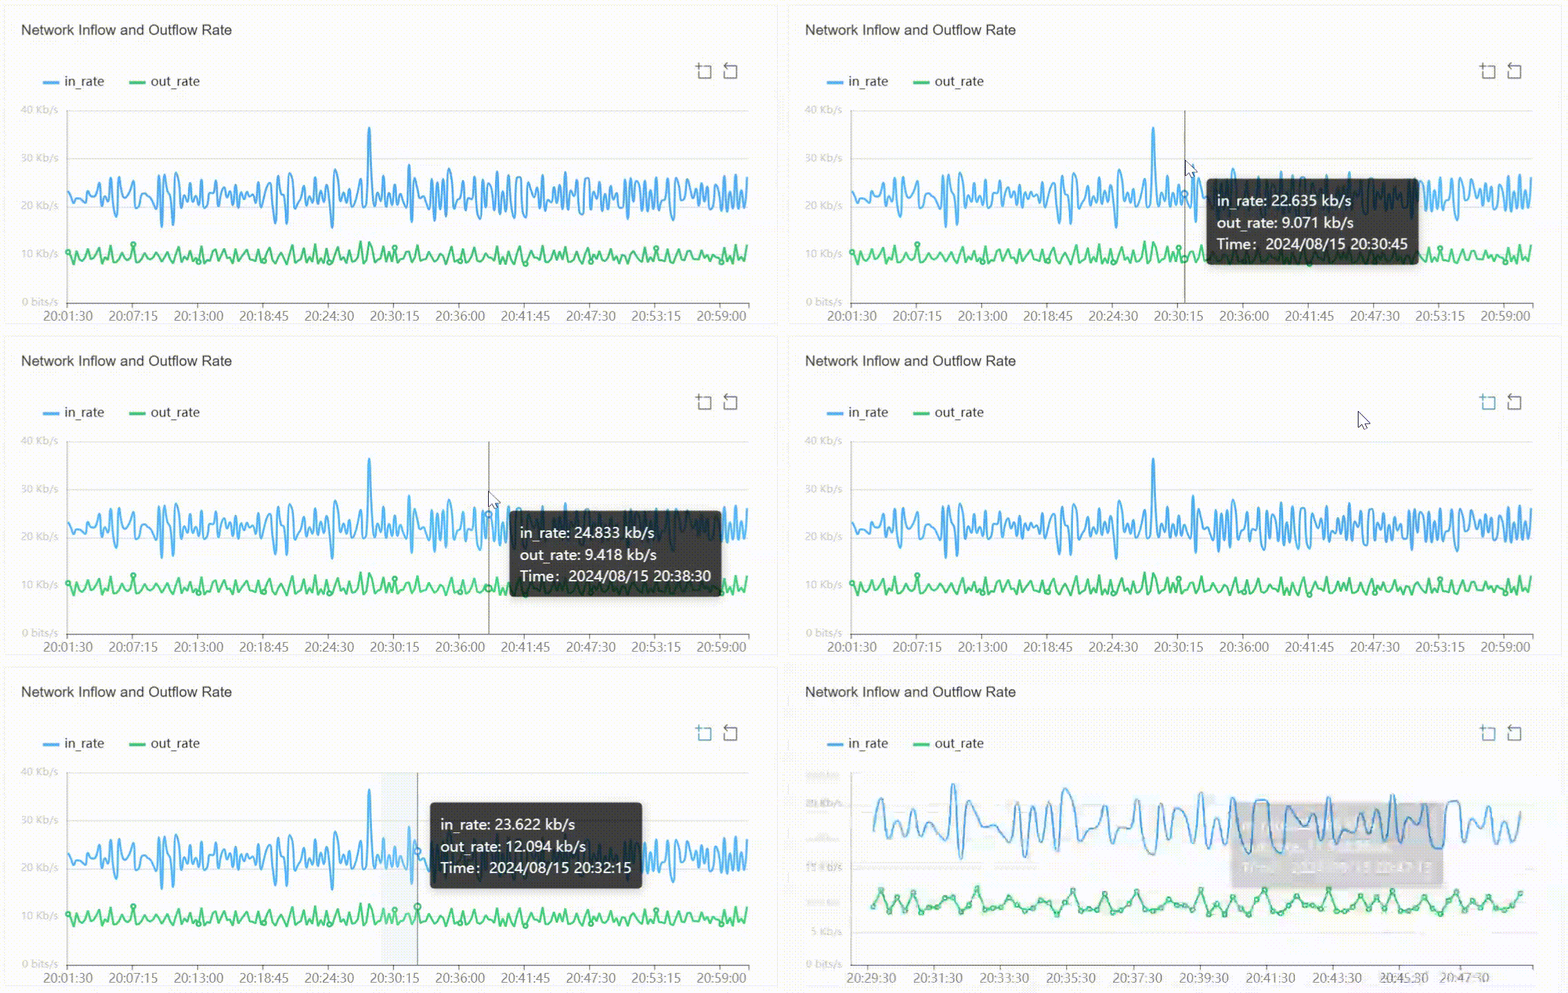
Use Case: This data widget is only available for monitoring P-Series Software PBX. It shows the PBX’s network inflow and outflow rates over a specified time period you selected. These data can help you understand the network utilization of the PBX and identify if there are any bandwidth issues that may affect call quality and user experience.
For details on resource monitoring for P-Series Software and Appliance edition, please refer to the user guide.
System Requirements
To utilize the monitoring feature on YCM, the firmware of your P-Series PBX system should meet the following requirements, otherwise the PBX data mentioned in this blog will not be reported to the YCM.
- P-Series Cloud Edition: Version 84.15.0.22 or later
- P-Series Appliance Edition: Version 37.15.0.91 or later
- P-Series Software Edition: Version 83.15.0.91 or later
If you want to monitor P-Series Appliance or Software Edition, you will also need to connect the PBX to the YCM platform. Learn how to connect your Yeastar software & hardware PBX to YCM.
Note: The resource monitoring feature for the P-Series Appliance and Software Edition is currently in beta and available for free testing for Yeastar Remote Management (RM) users. For partners who want to try the feature but doesn’t have a remote management account, you can enable 30-day RM free trial.
Become a Yeastar Partner
As a channel-only vendor, Yeastar listens to partners and provides all-around support for partner success. If you are an MSP or telecom reseller looking for new PBX phone system solution, there is no better time to get in touch with us. We will present you with a live demo of how we help partners succeed.
Our robust PBX profiles, combined with our unparalleled Central Management platform, are sure to give you a competitive edge.

